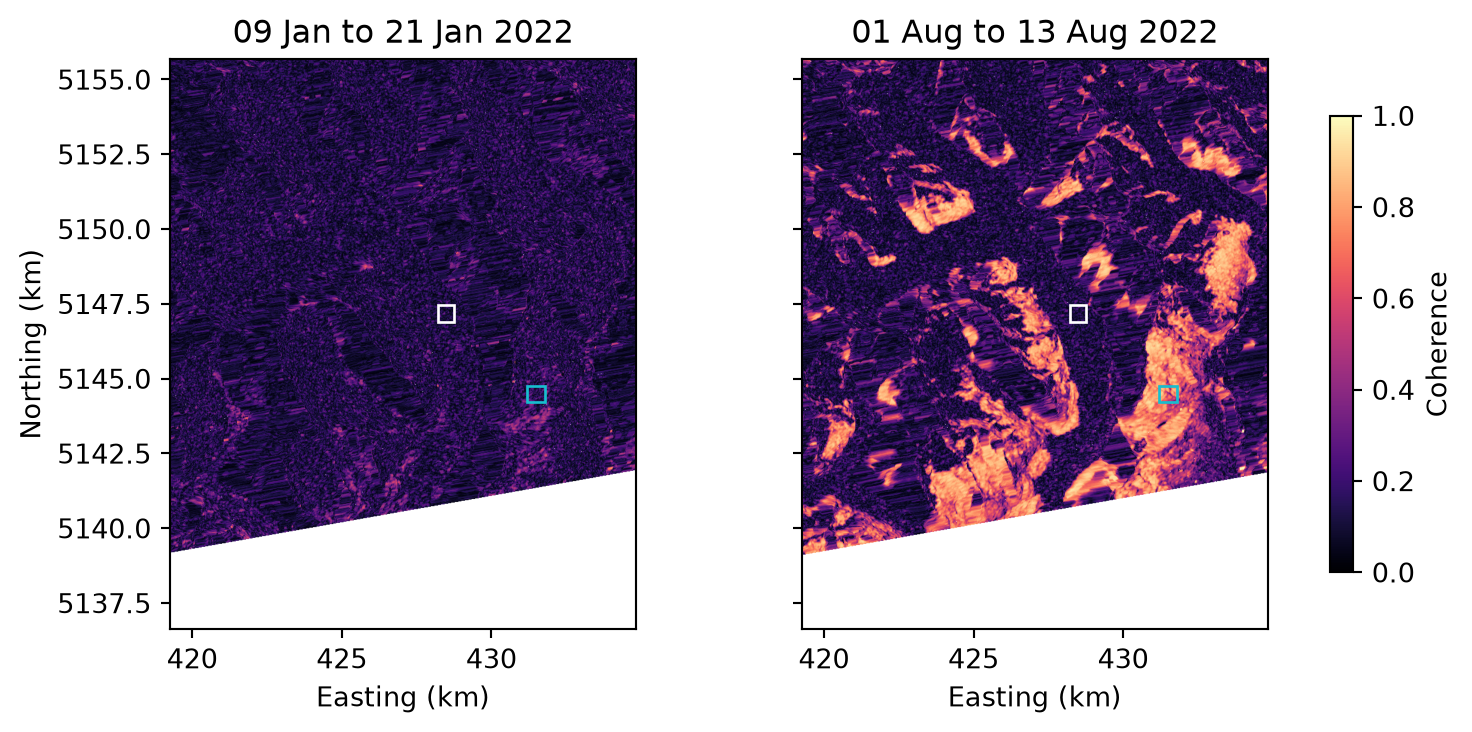
This tutorial computes coherence for one 12-day pair per month over the Aletsch glacier in 2022. Coherence shows where the surface stayed the same between two acquisitions, so it separates moving ice and changing snow from stable ground.
Process one pair per month
The search is the same as in the backscatter tutorial. find_pairs() forms every pair of acquisitions 12 days apart. Keeping the first pair of each month leaves twelve, which are processed into coherence:
from s1bursts import BurstCatalog, BurstProcessor, CoherenceConfig, FileManager, SearchQuery, TimeRange
from s1bursts.burst import BurstPairCollection

fm = FileManager("data/glacier")
catalog = BurstCatalog(fm)
bursts = catalog.search(SearchQuery(
    time_range=TimeRange("2022-01-01", "2022-12-31"),
    burst_id=30346, sub_swath="IW1", polarization="VV",
))

df = bursts.find_pairs(baseline=12).df.sort_values("date_1")
monthly = BurstPairCollection(df.groupby(df.date_1.dt.month).head(1))
print(f"{len(monthly)} pairs selected")
catalog.download(monthly).raise_on_failure()
processor = BurstProcessor(fm)
coherence = processor.create_coherences(
    monthly, crs="auto", config=CoherenceConfig(grid_spacing=20),
).raise_on_failure()
Coherence in winter and summer
The maps compare a winter pair with a summer pair. In January almost the whole area is snow-covered and incoherent. Snow decorrelates quickly: new snow and melt change it between the two dates, and wet snow can lose its coherence within hours (Strozzi et al., 1999). In August the slopes around the glacier are highly coherent, while the glacier is dark, which makes its outline stand out.
import matplotlib.pyplot as plt
from rasterio.warp import transform_bounds
from rasterio.windows import from_bounds
from shapely.geometry import box

view = (7.95, 46.38, 8.15, 46.55)  # lon/lat bounds of the map
areas = {
    "glacier": (box(8.065, 46.472, 8.072, 46.477), "white"),
    "no glacier": (box(8.104, 46.448, 8.112, 46.453), "tab:cyan"),
}
products = sorted(coherence.products, key=lambda p: p.date_primary)

fig, axes = plt.subplots(1, 2, figsize=(7.8, 3.7), sharey=True, layout="constrained")
for ax, product in zip(axes, [products[0], products[7]]):
    with fm.open(product) as src:
        left, bottom, right, top = transform_bounds("EPSG:4326", src.crs, *view)
        coh = src.read(1, window=from_bounds(left, bottom, right, top, src.transform))
        for area, color in areas.values():
            x0, y0, x1, y1 = transform_bounds("EPSG:4326", src.crs, *area.bounds)
            ax.add_patch(plt.Rectangle((x0 / 1000, y0 / 1000), (x1 - x0) / 1000,
                                       (y1 - y0) / 1000, fill=False, edgecolor=color))
    image = ax.imshow(coh, extent=[v / 1000 for v in (left, right, bottom, top)],
                      cmap="magma", vmin=0, vmax=1)
    ax.set(title=f"{product.date_primary:%d %b} to {product.date_secondary:%d %b %Y}", xlabel="Easting (km)")
axes[0].set_ylabel("Northing (km)")
fig.colorbar(image, ax=axes, shrink=0.8, label="Coherence")
plt.show()
Follow coherence through the year
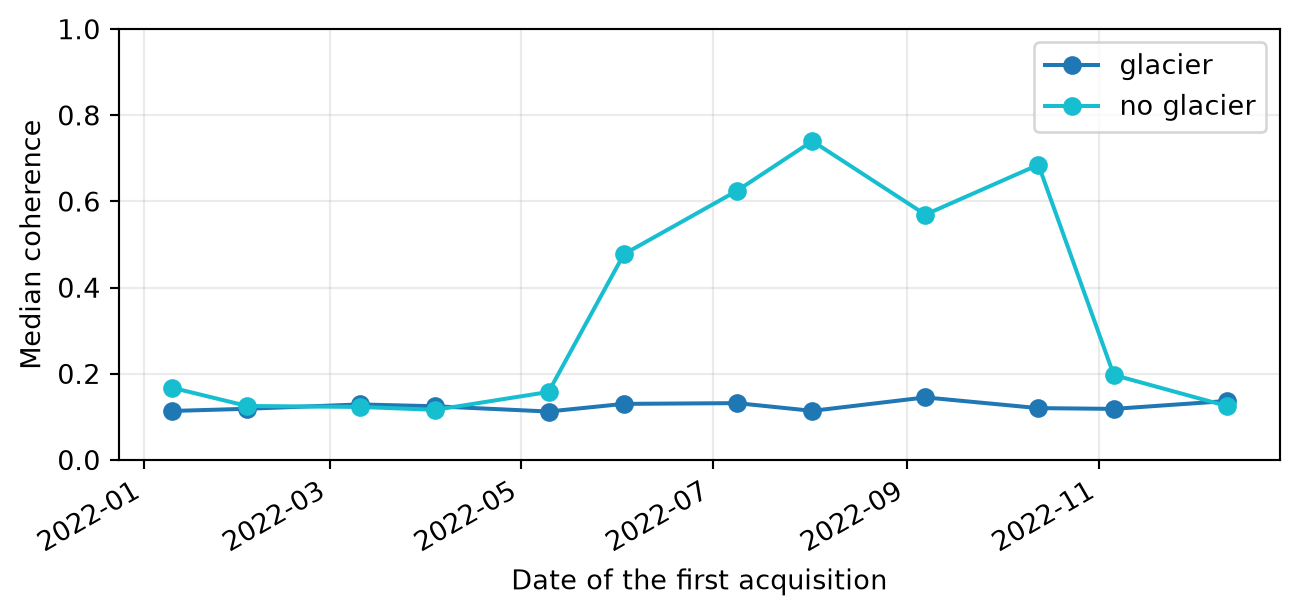
The time series takes the median coherence of each pair within the two rectangles, one on the glacier and one on a slope east of it without glacier.
import numpy as np
import pandas as pd
from rasterio.mask import mask
from rasterio.warp import transform_geom
from shapely.geometry import mapping

records = []
for product in products:
    with fm.open(product) as src:
        for name, (area, _) in areas.items():
            region = transform_geom("EPSG:4326", src.crs, mapping(area))
            values, _ = mask(src, [region], indexes=1, crop=True, filled=False)
            valid = values.compressed()
            records.append({"date": product.date_primary, "area": name,
                            "coherence": np.median(valid[np.isfinite(valid)])})
series = pd.DataFrame(records).pivot(index="date", columns="area", values="coherence")

fig, ax = plt.subplots(figsize=(7.8, 3.3))
for name, (_, color) in areas.items():
    ax.plot(series.index, series[name], "o-", label=name,
            color="tab:blue" if color == "white" else color)
ax.set(xlabel="Date of the first acquisition", ylabel="Median coherence", ylim=(0, 1))
ax.legend()
ax.grid(alpha=0.25)
fig.autofmt_xdate()
plt.show()
Interpret the result
On the glacier, coherence stays near 0.12 all year. Values this low mean that the two acquisitions are essentially unrelated. They do not reach 0, because the coherence magnitude estimated from a finite window of pixels is biased toward higher values, most strongly where coherence is low (Touzi et al., 1999). The glacier flows, and its surface melts or gains new snow, so 12 days are too long for it to stay coherent.
Off the glacier, coherence follows the snow cover. It is low from November to May, rises in June, and stays between 0.57 and 0.74 until October, when the snow returns. Summer coherence therefore separates the glacier from the terrain around it, even where both look similar in backscatter.
Shorter baselines keep more coherence. In 2022 only Sentinel-1A was operating, so 12 days is the shortest baseline available for these dates.
Run on 09 November 2026 with s1bursts 0.9.0 and ESA SNAP 13.0.0. Contains modified Copernicus Sentinel data (2022).